

Service and parts reporting built on your repair orders, from labor rate and shop load to retention, where your customers come from, and parts margin.
Service performance
The key measures of the service department, graded against benchmark targets that each store can override.
- Effective labor rate (what you actually collect per labor hour) and its trend.
- Hours, labor, parts and lines per repair order, and how many repair orders have only one line.
- Parts gross margin, the mix of customer-pay, warranty and internal work, and revenue by pay and service type.
- Bay utilization and shop load by weekday, and how many days repair orders stay open.
- Top repair types by frequency and revenue, with which ones are rising or falling.
- Advisor and technician performance, a technician proficiency grid and reconditioning cycle time.
Retention
See whether the customers you sell to keep coming back for service.
- First-visit retention within six months of purchase.
- Purchase-to-service retention in year two.
- Visit frequency and your top customers.
Where your service customers come from
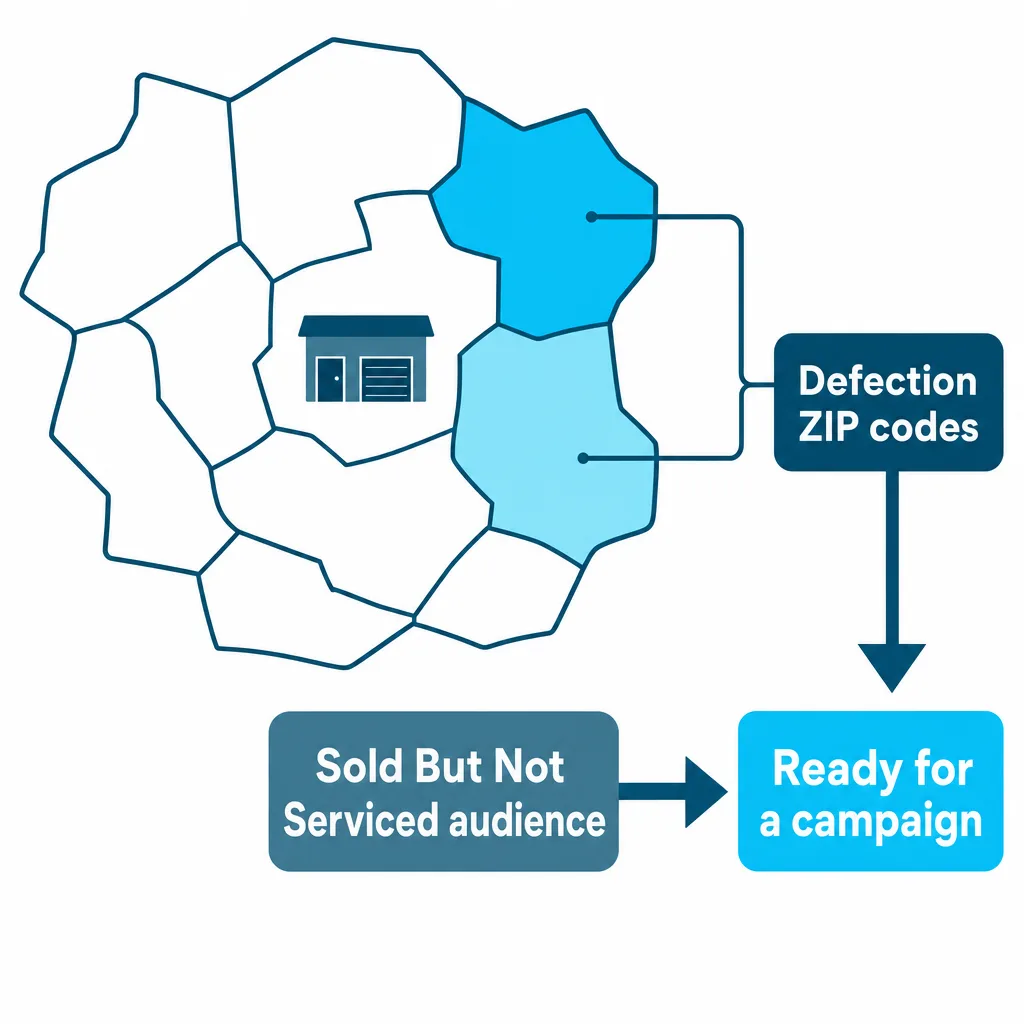
A service draw map by ZIP code shows your reach, and where buyers are servicing somewhere else.
- Defection ZIP codes highlight areas where customers bought from you but don’t service with you.
- A Sold But Not Serviced audience collects buyers with no repair order in the last 12 months, ready for a campaign.
Parts performance
Follow parts revenue and margin, and find stock that ties up cash.
- Revenue and gross by sale type, margin by channel and revenue by manufacturer.
- Top parts, counter person performance, price overrides and returns.
- Fill rate and lost sales by stocking group.
- Inventory aging, idle capital, and overstock versus understock.
Reports and the data behind them
Share results on a schedule, for one store or a whole group.
- A Service Report PDF for one store or many, with year-over-year comparison, emailed on a schedule.
- DMS repair orders with labor, parts, comment and fee lines, pay types, odometer, coupon, appointment time and customer ZIP, plus parts sales, parts inventory snapshots and service accounting.
- Service history is shared across stores in the same dealer group.
- Call tracking classifies service and parts calls and tracks appointments set.
Frequently asked questions
What service department KPIs should a dealership track?
Core service measures include effective labor rate, hours and lines per repair order, bay utilization, shop load, retention and parts gross margin. Axion’s service and parts analytics reports each of these from the dealership’s repair orders, graded against benchmark targets that each store can override.
How do I measure customer retention in my service department?
Axion measures first-visit retention within six months of purchase, purchase-to-service retention in year two, visit frequency and top customers. A Sold But Not Serviced audience collects buyers with no repair order in the last 12 months, ready for a campaign through Service audiences.
What is a service draw map?
A service draw map shows where a dealership’s service customers come from by ZIP code. Axion’s draw map also highlights defection ZIP codes, the areas where customers bought from the store but don’t service with it.
Can I track dealership parts department performance and idle inventory?
Yes. Axion’s parts analytics reports revenue and gross by sale type, margin by channel, top parts, counter person performance, price overrides and returns. It also shows fill rate and lost sales by stocking group, inventory aging, idle capital, and overstock versus understock.
Does Axion’s service analytics work with my DMS?
Yes. Axion works with any DMS, reading repair orders with labor, parts, comment and fee lines, plus parts sales and inventory snapshots, and service history is shared across stores in the same dealer group.
See your service and parts numbers in one place
We’ll show you the service and parts reports, the retention measures and the draw map for a store like yours.